Correspondence reveals deceit of Evansville’s supposed environmental protection regime

November 17, 2012-by John Blair, valleywatch.net editor

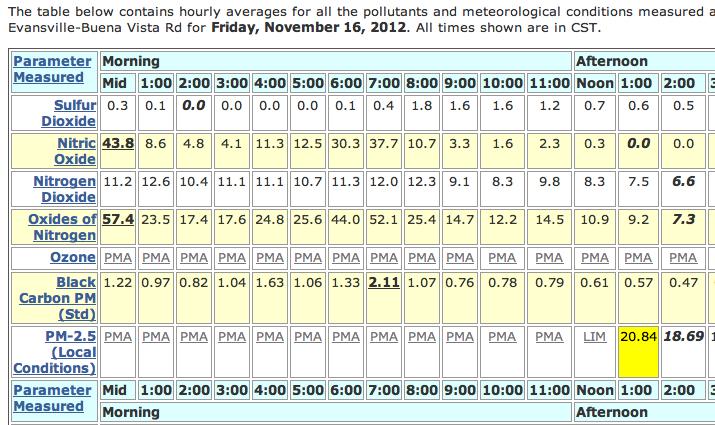
Yesterday we complained that Evansville’s air quality was unhealthy but that the monitor which is supposed to verify particulate air quality was conveniently out of service, supposedly for preventative maintenance. Shortly, after our post the monitor returned to service showing fine particles nearing the level of violation of the 24 hour standard of 35µg/m3. Monitor data is supposed to be near real time at: http://leads.idem.in.gov/cgi-bin/idem/daily_summary.pl

This morning, levels reached a whopping 45.13µg/m3 in the 7 AM hour.

In the post yesterday I promised to post some correspondence between Valley Watch board member, Jean Webb and Director of Evansville’s Department of Sustainability, Energy and Environmental Quality, Dona Bergman. This correspondence shows how that department always has an excuse for high readings of the various monitors in and around Evansville which has come to be a tradition encompassing bi-partisan administrations all the way back to 1980. Then, Evansville EPA director, Joan Shelton always called exceedances of the health based standards, “a glitch in the equipment.”

This is a screen shot showing the near real time data provided by IDEM. Notice that during the period of really high levels that occurred on 11/16 AM are missing and only represented by PMA.

Continue reading

Posted in Uncategorized | Tagged , , , , , | 2 Comments

Air quality in Evansville is atrocious but of course the official monitors are not working

November 16, 2012-by John Blair valleywatch.net editor

Below is a picture I shot this morning of the atrocious air pollution in Evansville today, 11/16. It was basically the same yesterday as fine particles built up in the region. Unfortunately, IDEM nor  the local EPA has any data to record what is probably an exceedance of the 24 hour fine particle standard so there is no air pollution alerts or anything to warn people of the severity of the problem.

This is what the air looked like this morning in Evansville along Riverside Drive, as fine particle pollution rose to unhealthy levels. Unfortunately, we will not know just how unhealthy since once again the official monitor for the city was “down for preventative maintenance” for this air pollution event, which started yesterday. Valley Watch has completely lost trust in both IDEM and the local EPA to provide honest assessments of air quality since it seems the monitors never work correctly when the air quality is bad. Photo: © 2012 John Blair

IDEM is supposed to maintain a near real-time data website (http://leads.idem.in.gov/cgi-bin/idem/daily_summary.pl) but for the last two days, while air quality worsened, their site shows absolutely no data using the term PMA instead of quantitative figures. IDEM defines PMA as: “PMA – Preventative maintenance. Indicates the CAMS is undergoing maintenance and data collected is not valid data.”

Sadly, what is happening today and yesterday will likely not be included in any determination of whether or not we actually meet the health based standards for fine particles  since the monitor is conveniently down for “preventative” maintenance. Maybe by “preventative” they mean prevent a violation of the standard.

I am asking for permission to publish a letter a Valley Watch board member received from Evansville EPA leader, Dona Bergman and will share that when permission is received but in the meantime here are two sentences from that letter, date August 1, 2012 which was in response to data that USEPA had collected which showed EVV air quality was worse than the State and local governments were acknowledging, “For much of the period you examined, the data from the BV continuous monitor had a high bias (see for example the chart below).  In fact, quite a bit of the Buena Vista monitor’s data were removed from IDEM’s websites because they were invalidated.”

It seems that every time there is an air quality problem around here there is some kind of excuse forthcoming as to why the official monitors are incorrect except on days when air quality is on the good side, then they are never wrong.


Posted in Uncategorized | Tagged , , , , , | 7 Comments

Climate Likely to Be on Hotter Side of Projections

November 9, 2012-Press Release from NASA

A new NASA-funded study by the National Center for Atmospheric Research, Boulder, Colo., finds climate model projections that show a greater rise in global temperature are likely to prove more accurate than those showing a lesser rise. The findings, published today in the journal Science, could provide a breakthrough in the longstanding quest to narrow the range of global warming expected in coming decades and beyond.

National Center for Atmospheric Research scientists John Fasullo and Kevin Trenberth analyzed how well 16 leading sophisticated climate models reproduce observed relative humidity in Earth’s tropics and subtropics. They used observations from two NASA satellite instruments – the Atmospheric Infrared Sounder (AIRS) instrument on NASA’s Aqua spacecraft and the Clouds and Earth’s Radiant Energy System (CERES) instruments that fly on several NASA Earth satellites – along with a NASA data analysis called the Modern-Era Retrospective Analysis for Research and Applications (MERRA). AIRS was built by and is managed by NASA’s Jet Propulsion Laboratory, Pasadena, Calif.

The researchers found the climate models that most accurately captured these complex moisture processes and associated clouds, which have a major influence on global climate, were also the ones that showed the greatest amounts of warming as society emits more greenhouse gases into the atmosphere.

“There is a striking relationship between how well climate models simulate relative humidity in key areas and how much warming they show in response to increasing carbon dioxide,” said Fasullo. “Given how fundamental these processes are to clouds and the overall global climate, our findings indicate that warming is likely to be on the high side of current projections.” Continue reading

Posted in Uncategorized | Tagged , , , | Leave a comment

Most energy subsidies go to fossil and nukes, not clean energy as the corporatists would have you believe

November 7, 2012-by Daniel B. Botkin in E-The Environmental Magazine

A persistent and common criticism of solar and wind energy is that they don’t pay their own way, but require government subsidies.  Discounting one-time allocations under the now infamous bailout funds, the reality is just the opposite: fossil fuels, nuclear power, and crop biofuels have been getting larger federal subsidies than solar and wind.

Most critics are unaware of this. For example, Republican presidential candidate Mitt Romney writes in his Energy Policy that “wind and solar power, two of the most ballyhooed forms of alternative fuel, remain sharply uncompetitive on their own with conventional resources such as oil and natural gas in most applications. Indeed, at current prices, these technologies make little sense for the consuming public but great sense only for the companies reaping profits from taxpayer subsidies.”

Reason magazine has made a particular point of condemning solar and wind for the same reason.  For example, Scott Shackford, an associate editor of Reason, wrote on August 10, 2012: “This week the Department of Defense announced it would open up 13 million acres of public land for renewable energy development. How much of that will require government subsidies of manufacturers to actually happen?”

The amount spent on wind and solar is a pittance. The lion’s share of subsidy dollars actually goes to non-renewable energy. A study by the Environmental Law Institute, Estimating U.S. Government Subsidies to Energy Sources: 2002—2008, shows that during that period traditional fossil fuels received $70.2 billion in federal subsidies, whereas corn ethanol received $16.8 billion, and “traditional renewables,” which include solar and wind received, $12.2 billion, 17% of the amount received by fossil fuels.

A report by the Department of Energy’s own Energy Information Agency, Direct Federal Financial Interventions and Subsidies in Energy in Fiscal Year 2010, showed that in 2010 solar energy received $1.134 billion in federal subsidies; coal $1.358;  natural gas and petroleum $2.820; nuclear $2.499; wind $4.986; and biofuels (mainly corn ethanol) $6.644.  In short, fossil fuels and nuclear together received $6.677 billion in direct subsidies, while solar and wind together received $6.120 billion. 

In addition, there is a major difference in the way the direct federal subsidies help nonrenewables and renewables.  According to the Environmental Law Institute, “Most of the largest subsidies to fossil fuels were written into the U.S. Tax Code as permanent provisions. By comparison, many subsidies for renewables are time-limited initiatives implemented through energy bills, with expiration dates that limit their usefulness to the renewables industry.”

Continue reading

Posted in Uncategorized | Tagged , , , , , | Leave a comment

Grist Magazine’s David Roberts explains climate change in a TED presentation

This video is to promote general awareness of the science of climate change. It features David Roberts of Grist, and short clips from around the web. Edited by @ryanlcooper. Find more of my stuff at http://www.ryanlouiscooper.com. Find David at http://grist.org/author/david-roberts/ and @drgrist, and documentation on the talk at http://grist.org/climate-change/climate-change-is-simple-we-do-something-or-w….

Posted in Uncategorized | Tagged , , , , | Leave a comment

Rate/Taxpayers end up losers in bizarre authoritarian scheme called Indiana Gasification

October 28, 2012-by Mike Jarmus in the Ft. Wayne Journal Gazette

You might not have, but the Indiana state government has signed a deal to potentially pass down the loss to taxpayers and natural gas users alike. Tracy Warner’s Oct. 2 column, headlined “A costly natural gas deal,” brought to light this little-known contract agreement. Lawmakers may have initially had great cost-effective intentions while brokering this agreement, but currently this deal will be extremely costly to all.

Rockport, Indiana is already one of the most toxic polluted towns in the world. The proposed plant will sit just across the highway from two existing industries that already emit more than 30,000,000 pound of toxic chemicals. If Environmental Justice means anything, the federal Government will not issue a $3.5+ loan guarantee to Indiana Gasification which is required in addition to forcing Indian taxpayers and ratepayers to assume the substantial risk and pay a 2-300% premium just for the privilege of getting their home heating gas from coal. Aerial Photo © 2011 John Blair.

Four if not five years ago, $6.60 per 1 million BTUs of natural gas that the state agreed to purchase was a fair price. However, with the recent natural gas boom in the United States, this is no longer true.

The advancements the industry has made in extraction methods, such as fracking, have made once hard-to-reach natural gas accessible. Along with last year’s warm winter, this has created a surplus in natural gas and forced a record-breaking decrease in prices.

These record lows can be seen with the average natural gas price being only $2.63 to this point in 2012. The markets have been on a slight rise recently, but October’s price settled at $3.02. The price in the foreseeable future will not be coming anywhere close to the $6.60 price that the state will be paying.

These numbers might not seem very large. What does a couple of dollars matter when you receive 1 million BTUs of natural gas? Well, when you take into consideration that the U.S. Energy Information Administration showed in its latest numbers that Indiana used a little more than 5.61 trillion BTUs in 2010 alone, it adds up. Continue reading

Posted in Uncategorized | Tagged , , , , , | Leave a comment

Indiana Representatives, Carson and Visclosky score “A” while the rest of indiana Congressional delegation scores “F” on clean water protections on 40th Anniversary of the Clean Water Act

October 18, 2012-Sierra Club press release

Today the Sierra Club marked the 40th anniversary of the Clean Water Act by releasing a Clean Water Voting Record for the U.S. House of Representatives.  The online report card features an interactive map and issues letter grades for U.S. Representatives’ voting records on clean water issues.

The House has voted to endanger the drinking water sources of 117 million Americans, allow toxic pesticide discharges into our waterways without oversight  and halt strong protections for toxic coal ash and destructive mountaintop removal, just to name a few. 

“Americans rely on clean water – we need it to drink, grow our crops and supply our food.  Many of us depend on it for the things we enjoy most – swimming, boating, hunting and fishing,” said Michael Brune, Executive Director of the Sierra Club.  “For forty years, the Clean Water Act has helped protect our water.  But in the 112th Congress, we’ve seen an unprecedented attack from House Leadership on clean water policy.”

The Sierra Club’s Clean Water Report Card highlights which members of Congress side with Americans who care about clean water and who sides with big polluters.

“The Clean Water Act is one of America’s great success stories,” said Brune.  “Take for example, the Cuyahoga River in Ohio, which at one time was one of the most polluted rivers in the nation.  The Cuyahoga was so polluted, that it actually caught on fire multiple times in the late 1960s.  Since the passage of the Clean Water Act in 1972, the Cuyahoga – once devoid of fish – now supports 44 species and is recognized as an American Heritage river.”

“Today we should celebrate that success and move forward to build on that progress to ensure that our children and our children’s children will have safe, clean water.”

View the Sierra Club’s new Clean Water Report Card Here.

Posted in Uncategorized | Tagged , , , , | 1 Comment

What Is The Future Of King Coal In China?

October 16, 2012-by Ailun Yang in WRIInsights

When it comes to coal consumption, no other nation comes close to China. The country reigns as the world’s largest coal user, burning almost half of the global total each year. About 70 percent of China’s total energy consumption and nearly 80 percent of its electricity production come from coal, and its recent shift from being a historical net coal exporter to the world’s largest net coal importer took only three years.

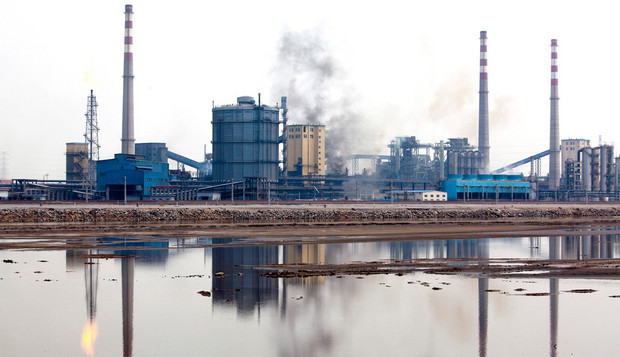
A coal processing facility at the Bohai New Area port zone of Cangzhou, Hebei Province, China. Traditional wisdom has been that China is building massive numbers of new coal-fired plants, and that such development would continue forever. Photographer: Adam Dean/Bloomberg

China’s great thirst for coal is undeniably troubling from a sustainable development standpoint. However, the situation may be changing. I recently joined three other experts to speak at a Congressional briefing entitled, “Why China Is Acting on Clean Energy: Successes, Challenges, and Implications for U.S. Policy.”While my fellow speakers spoke about the progress of clean energy development in China, I sought to explain how the growing constraints on coal development are acting as one factor pushing China to move more aggressively towards clean energy.

What’s Pushing China Toward Clean Energy?

Traditional wisdom has been that China is building massive numbers of new coal-fired plants, and that such development would continue forever. However, two new indicators seem to be telling a different story.

The first and arguably most important indicator is the weak economic performance of China’s coal power sector, which accounts for more than half of China’s coal consumption. China’s State Electricity Regulatory Commission (SERC) reportedthat almost all coal-fired plants have been losing money since last year. Investment in coal-fired plants in 2011 was not even half of what was invested in 2005. About one-third of the proposed new coal–fired plants that have been approved are delaying the start of their construction, resulting in a big slowdown in newly added coal power capacity. In fact, based on the number of coal-fired plants completed this year so far, newly installed capacity is likely to be only half of what was installed last year.

This dramatic decrease in new coal development is mainly a result of China’s economic slow-down and weaker demands for new energy. It is also a result of the long-standing electricity sales price freeze imposed by the Chinese government on the power sector.

Another important trend not to be overlooked is the rising public concern over coal’s environmental and health impacts. In response to unprecedented deterioration of the environment, public awareness of environmental problems is rising rapidly. The number and scale of local social unrest incidents against pollution are mounting across the country, many of which are related to coal-fired plants. Some of these incidents have gotten international attention. In December 2011, for example, nearly 30,000 local residents protested against the expansion of a coal-fired power plant in Haimen, Guangdong Province. The project was quickly suspended after the protest turned violent.

The Future of China’s Energy System

These recent trends further demonstrate that China’s over-dependency on coal is not sustainable. The growing constraints on China’s coal development will give China more incentives to transform its energy system towards a more clean and low-carbon future.

Posted in Uncategorized | Tagged , , , , , | Leave a comment

Even on a “clear” day pollution abounds in Rockport, Indiana

October 14, 2012-by John Blair, valley watch.net editor.

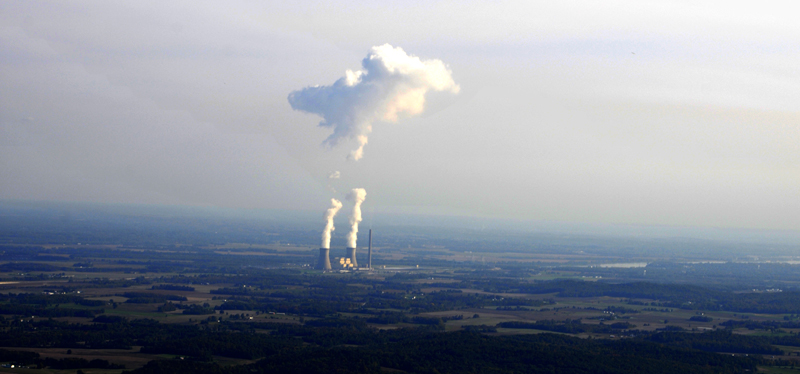
AEP’s Rockport power plant not only dominates the skyline in SW Indiana, it also makes clouds. A close inspection of this photo taken © October 12, 2012 by John Blair shows  several impacts this coal plant and others like it have on regional air quality.

First, it obviously impacts the local weather by creating moisture laden clouds immediately above the cooling towers of the plant. This was the only cloud in the entire sky on a recent aerial photo flight.

The blue area  at the horizon is likely sulfate particles which are damaging to humans and when combined with water becomes sulfuric acid which is harmful to nearly everything.

A little higher, the particles in the air become sooty and brown, representing nitrogen oxides and other pollution from burning coal.

In this case, according to EPA’s eGRID database, the Rockport plant, each year emits a whopping 2,517,032 pounds of air toxins that impact the health of residents far and wide surrounding the plant. On a more global perspective, Rockport emits over 18 million tons of carbon dioxide, 54,796 tons of sulfur dioxide and almost 20,000 tons of nitrogen oxides.

Although AEP is legally bound to put scrubbers on the plant by 2018, they currently are trying to wiggle out of a consent decree and spend less money to do a lesser job of cleaning their pollution.

The plant was the last huge plant in the nation to use what are called “Tall” stacks to disperse emissions over a wider area. The Rockport stack juts a 1040 feet into the air to belch its deadly chemicals over a wider region. Congress abandoned tall tall stacks when they passed the Clean Air Act Amendments of 1977. This plant “announced” about the same time, was “grandfathered” under the old law even though it was built after the Amendments passed.


Posted in Uncategorized | Tagged , , , , , | Leave a comment

The New York Times Says Data Centers Suck — But Here’s What They Missed

September 25, 2012-By Robert McMillan in Wired. Editor’s note: This page has long advocated substantial increases in energy efficiency as well as increased use of electronic files to mitigate the use of paper across society. The Times report linked below and this story reflect on why there is a perceived need to build more and more power plants using increased fossil fuels when there might be other answers that will save us both money and the planet.

When The New York Times published the first part of its sweeping investigative report on the state of the world’s data centers, it led with a six-year-old story about Facebook dispatching engineers to local Walgreens stores in a desperate bid to cool down the 40- by 60-foot rental that was home to the company’s servers.

The report — which ran on the front page of the paper this Sunday, above the fold — then proceeded to describe an extremely wasteful industry that’s “sharply at odds with its image of sleek efficiency and environmental friendliness.”

Yes, data centers are wasteful. But Facebook, for one, has evolved over those six years — significantly. And that’s no secret. Largely lost amid the Times’ multiple-page analysis is the fact that the data centers built by a handful of internet giants are looking less and less like the 40- by 60-foot rental space that was home to Facebook back in 2006 — and that these advances are just beginning to trickle down to the rest of the industry.

Facebook engineers no longer forage for fans. They think about how to optimize undersea cable routes. They design brand-new ways of storing data with some of the power turned off. They even design their own servers. And Facebook is now sharing many of its designs with the rest of the world.

Companies like Google and Apple and Amazon are also building a new generation of data centers that look nothing like that 40- by 60-foot overheated Facebook cage from 2006. But they’re doing most of this work in secret. “We generally don’t give out — for competitive advantage — a lot of details,” says an engineer with a large internet company who, well, wasn’t authorized to speak with the press. In fact, none of the big internet companies we reached out to could provide us with on-the-record comment by deadline Monday.

That makes it tricky to write an investigative expose on the industry. The stuff that companies will talk about is often so out-of-date that it’s obsolete.

The Times asked McKinsey & Co. to study data-center energy use, and the consulting firm found that “on average, they were using only 6 percent to 12 percent of the electricity powering their servers to perform computations,” the newspaper reported.

That’s pretty much in line with what McKinsey was saying back in this 2008 PowerPoint presentation, where it found “6 percent average server utilization” overall and that 80 percent of servers were running at between 5 and 30 percent utilization. But at the biggest data-center operators, things are changing in so many other ways.

Continue reading

Posted in Uncategorized | Leave a comment

Weather Girl goes rogue in Labor Day forecast- satire with a message

Spetember 17, 2012-by Deep Rogue Ram

Arctic ice cover just reached its lowest point in recorded history. Pippa goes off script and drops some science. For more, check out http://www.deeprogueram.tumblr.com
Or Facebook: http://www.facebook.com/pages/Deep-Rogue-Ram/270636419712713
Or Twitter: https://twitter.com/deeprogueram

Posted in Uncategorized | Leave a comment

Symphony of Science: Our Biggest Challenge

A musical investigation into the causes and effects of global climate change and our opportunities to use science to offset it. Featuring Bill Nye, David Attenborough, Richard Alley and Isaac Asimov. “Our Biggest Challenge” is the 16th episode of the Symphony of Science series by melodysheep.

Visit http://symphonyofscience.com for more science remixes!

Posted in Uncategorized | 8 Comments

Kentucky 4th, Indiana 6th most polluted states according to new report

September 8, 2012, by Jen Alic, in Oilprice.com via CNBC

Half of all industrial toxic air pollution comes from power plants, and 6,700 power plants and heavy industries are responsible for 80 percent of all greenhouse gas emissions in the United States. Coal- and oil-fired power plants contribute 44 percent of all toxic air pollution. Toxic mercury and emissions from the country’s electricity sector are estimated to cause tens of thousands of premature deaths, heart attacks, asthma cases and chronic bronchitis every year.

Many of the US’ most toxic states have seen a reduction of pollution over the past several years, but a federal court of appeals ruling to scrap an EPA regulation on “Cross-State Air Pollution,” designed to reduce air pollution carried from one state to another. Power plants had been expecting this ruling to be approved for over a year, and had adjusted their practices accordingly. The immediate reaction to the federal court’s scrapping of the rule resulted in a queuing up of power plants to abandon preparations for this compliance. Likewise, the EPA’s Mercury and Air Toxics standards (MATs), designed to cut mercury air pollution beginning in 2015 by 79 percent from 2010 levels failed in the Senate in June.

So where are we now? Well, we’re stuck with this list of states that are the most toxic, and while much progress has been made, the list is likely to contain the usual suspects next year and fewer improvements on pollution.

Number 1: Ohio

Ohio’s electricity-generation sector emitted more than 36.4 million pounds of harmful chemicals in 2010, accounting for 62% of state pollution and about 12% of toxic pollution from all US power plants. The state also ranked 2nd in industrial mercury air pollution from power plants, emitting almost 4,210 pounds in 2010 (73 percent of the state’s mercury air pollution and 6 percent of US electricity sector mercury pollution).

Ohio is home to the Gen J M Gavin coal plant in Cheshire, which is the 9th biggest polluter in the United States, according to the EPA, which estimates the plant’s greenhouse gas emissions for 2010 at 16,872,856 CO2e.

Number 2: Pennsylvania

Pennsylvania is ranked third on the second annual “Toxic 20” ranking of states whose residents are exposed to the most pollution from coal- and oil-fired power plants. It represents a small improvement over last year, when Pennsylvania ranked second in the nation in the percentage of toxic pollution generated by power plants. Pennsylvania is responsible for some 10% of all toxic pollution from power plants in the US, releasing nearly 32 million pounds of harmful chemicals in 2010 alone.

From 2009 to 2010, air pollution from all sources in Pennsylvania dropped by 20 percent and from coal-fired power plants by 24 percent, according to HRDC.

Number 3: Florida

While the EPA ranked Florida the 6th worst polluter in 2010, the NRDC ranked it as 2nd worst in its 2012 list. Florida’s electricity-generation sector emitted nearly 16.7 million pounds of harmful chemicals in 2010, according to the EPA, accounting for 57 percent of all state pollution and 5 percent of toxic pollution from all US power plants. Florida’s electricity sector emitted some 1,710 pounds of mercury into the air, accounting for 75 percent of the entire state’s mercury air pollution for that same year.

Florida has undergone a major shift from coal to natural gas. Twelve years ago, natural gas accounted for less than 30 percent of Florida’s electricity production. By 2011, Florida was generating 62 percent of its total power from natural gas, with coal accounting for 23 percent. (Only Texas has a higher percentage.) Florida has three nuclear power plants, which accounted for just under 10 percent of electricity generation in 2011. Florida has 10 large power plants, eight of which are now fueled by natural gas.

However, despite the shift from coal to natural gas, Florida’s carbon dioxide emissions have continued to increase, while sulfur dioxide emissions have been reduced. Florida has seen its greenhouse gas emissions increase from 91 million tons in 1990 to 124 million tons in 2010.

Number 4: Kentucky

Kentucky may not have been ranked the worst overall polluter in the US, but it is ranked worst in terms of toxic air pollution from coal-fired power plants, with HRDC officials specifically citing Kentucky’s poor control over these plants and its failure to adopt any laws or regulations that would lead to a notable reduction in pollution.

Kentucky’s electricity sector actually saw an increase in toxic air pollution from 8.8 million pounds in 2009 to 9.6 million pounds in 2010.

It’s not likely to improve much. Just one day after a federal appeals court scrapped the EPA rule to curb long-distance power plant pollution drifting, the Kentucky-based Big Rivers Electric Cooperative power plant announced it would abandon pollution controls that would have allowed it to comply with the EPA’s regulation.

Number 5: Maryland

Ranked 5th overall for total industrial pollution, coal-burning power plants keep Maryland higher on the pollution list than the state would like. In terms of coal-burning power plant pollution, Maryland is ranked 19th by the NRDC, which also noted that the state’s toxic emissions from power plants dropped by 88 percent over the course of one year. The biggest polluters are the Chesterfield, Chesapeake and Clinch River power plants.

Number 6: Indiana

The Gibson coal plant in Owensville had total greenhouse gas emissions of 17,993,350 CO2e in 2010, according to the EPA, which ranked the plant the fifth worst polluter in the US. The state’s Rockport coal plant ranked the 10th worth polluter in the country, with total greenhouse gas emissions of 16,666,035 CO2e. Continue reading

Posted in Uncategorized | Leave a comment

Solar highways that produce energy

August 30, 2012- by YERTians

The Solar Roadways project is working to pave roads with solar panels that you can drive on. Co-founder Scott Brusaw has made some major steps forward since our first visit back in 2007, so we visited him again for an exclusive update on the project, including the first ever video recorded of the Solar Roadways prototype! For more information visithttp://www.solarroadways.com . This Solar Roadway project is highlighted as one of many planet-friendly solutions in the feature film by YERT – Your Environmental Road Trip. To learn more about YERT, visit http://yert.com .

Flattr this video here: https://flattr.com/thing/407726/YERT-video-about-Solar-Roadways-The-Prototype

And you can become a fan of YERT on Facebook here:http://www.facebook.com/home.php#!/pages/YERT-Your-Environmental-

Posted in Uncategorized | Leave a comment

Whitehouse announces new Federal auto mileage standards-54.5 MPG by 2025

August 28, 2012-by John Blair, valleywatch.net editor

To achieve the much greater mileage, electric cars are figured to play a big part. Tesla, Toyota, Nissan and GM and Ford are all offering some version of hybrid or plug-in model cars some of which already achieve the standards set for 2025. Other options could be fuel cell powered automobiles. Pictured is the Chevy Volt.

After years of debate and acquiescence, the Obama Administration today issued new Federal mileage regulations which will force auto manufacturers to increase fuel economy to an equivalent of 54.5 MPG for cars and light trucks by the year 2025.

These fuel standards represent the single most important step we’ve ever taken to reduce our dependence on foreign oil,” said President Obama. “This historic agreement builds on the progress we’ve already made to save families money at the pump and cut our oil consumption. By the middle of the next decade our cars will get nearly 55 miles per gallon, almost double what they get today. It’ll strengthen our nation’s energy security, it’s good for middle class families and it will help create an economy built to last.”

These new standards will undoubtedly transform our vehicle fleet and present new opportunities to improve the overall economy of the USA as well as that of the entire world. It will do that by changing not only vehicles, but also promoting a transformative “conservation ethic” which Valley Watch has been promoting since its inception in 1981.

New manufacturing norms, new technologies and new product lines will emerge as manufacturers seek new and better ways to improve transportation modes as well as infrastructure to accommodate the new standards.

According to Whitehouse projections, the new mileage standards will save American families more than $1.7 trillion dollars in fuel costs, resulting in an average fuel savings of more than $8,000 by 2025 over the lifetime of the vehicle. For families purchasing a model Year 2025 vehicle, the net savings will be comparable to lowering the price of gasoline by approximately $1 per gallon. Additionally, these programs will dramatically reduce our reliance on foreign oil, saving a total of 12 billion barrels of oil and reducing oil consumption by more than 2 million barrels a day by 2025 – as much as half of the oil we import from OPEC each day.

Posted in Uncategorized | Leave a comment